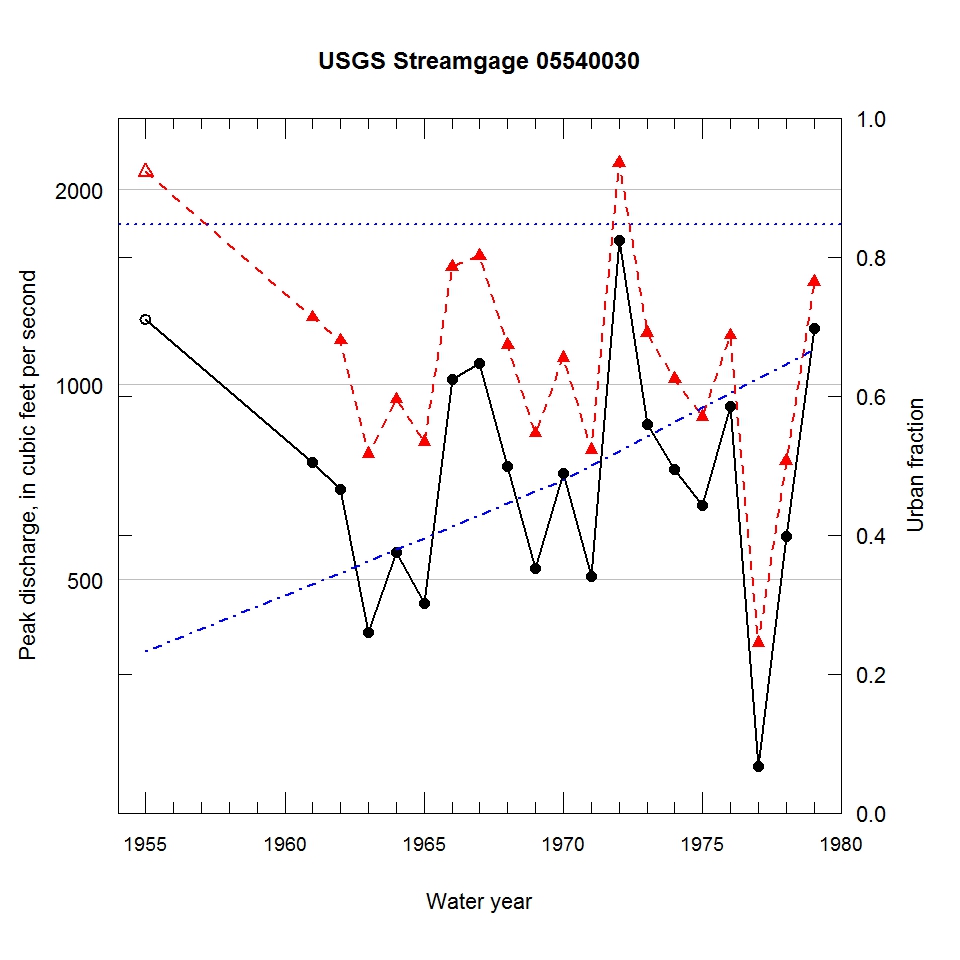
Observed and urbanization-adjusted annual maximum peak discharge and associated urban fraction and precipitation values at USGS streamgage:
05540030 WEST BRANCH DU PAGE RIVER AT WEST CHICAGO, IL


| Water year | Segment | Discharge code | Cumulative reservoir storage (acre-feet) | Urban fraction | Precipitation (inches) | Observed peak discharge (ft3/s) | Adjusted peak discharge (ft3/s) | Exceedance probability |
| 1955 | 1 | 7 | 558 | 0.232 | 3.467 | 1260 | 2130 | 0.053 |
| 1961 | 1 | -- | 558 | 0.329 | 1.383 | 758 | 1270 | 0.300 |
| 1962 | 1 | -- | 558 | 0.345 | 0.285 | 688 | 1170 | 0.387 |
| 1963 | 1 | 2 | 558 | 0.362 | 1.340 | 415 | 781 | 0.761 |
| 1964 | 1 | 2 | 558 | 0.379 | 2.080 | 550 | 948 | 0.596 |
| 1965 | 1 | 2 | 558 | 0.395 | 0.115 | 460 | 815 | 0.728 |
| 1966 | 1 | -- | 558 | 0.412 | 1.454 | 1020 | 1520 | 0.172 |
| 1967 | 1 | -- | 558 | 0.429 | 1.276 | 1080 | 1580 | 0.154 |
| 1968 | 1 | -- | 558 | 0.445 | 1.908 | 748 | 1150 | 0.406 |
| 1969 | 1 | 2 | 558 | 0.462 | 1.355 | 520 | 840 | 0.705 |
| 1970 | 1 | -- | 558 | 0.479 | 1.416 | 730 | 1100 | 0.456 |
| 1971 | 1 | 2 | 558 | 0.500 | 0.345 | 506 | 793 | 0.751 |
| 1972 | 1 | -- | 558 | 0.521 | 1.989 | 1670 | 2200 | 0.046 |
| 1973 | 1 | -- | 558 | 0.541 | 0.802 | 869 | 1200 | 0.366 |
| 1974 | 1 | -- | 558 | 0.562 | 0.599 | 740 | 1020 | 0.524 |
| 1975 | 1 | -- | 558 | 0.583 | 1.006 | 651 | 892 | 0.649 |
| 1976 | 1 | -- | 558 | 0.604 | 1.146 | 925 | 1190 | 0.369 |
| 1977 | 1 | -- | 788 | 0.625 | 1.339 | 257 | 399 | 0.975 |
| 1978 | 1 | -- | 788 | 0.646 | 0.852 | 584 | 762 | 0.777 |
| 1979 | 1 | -- | 788 | 0.667 | 0.281 | 1220 | 1440 | 0.199 |

